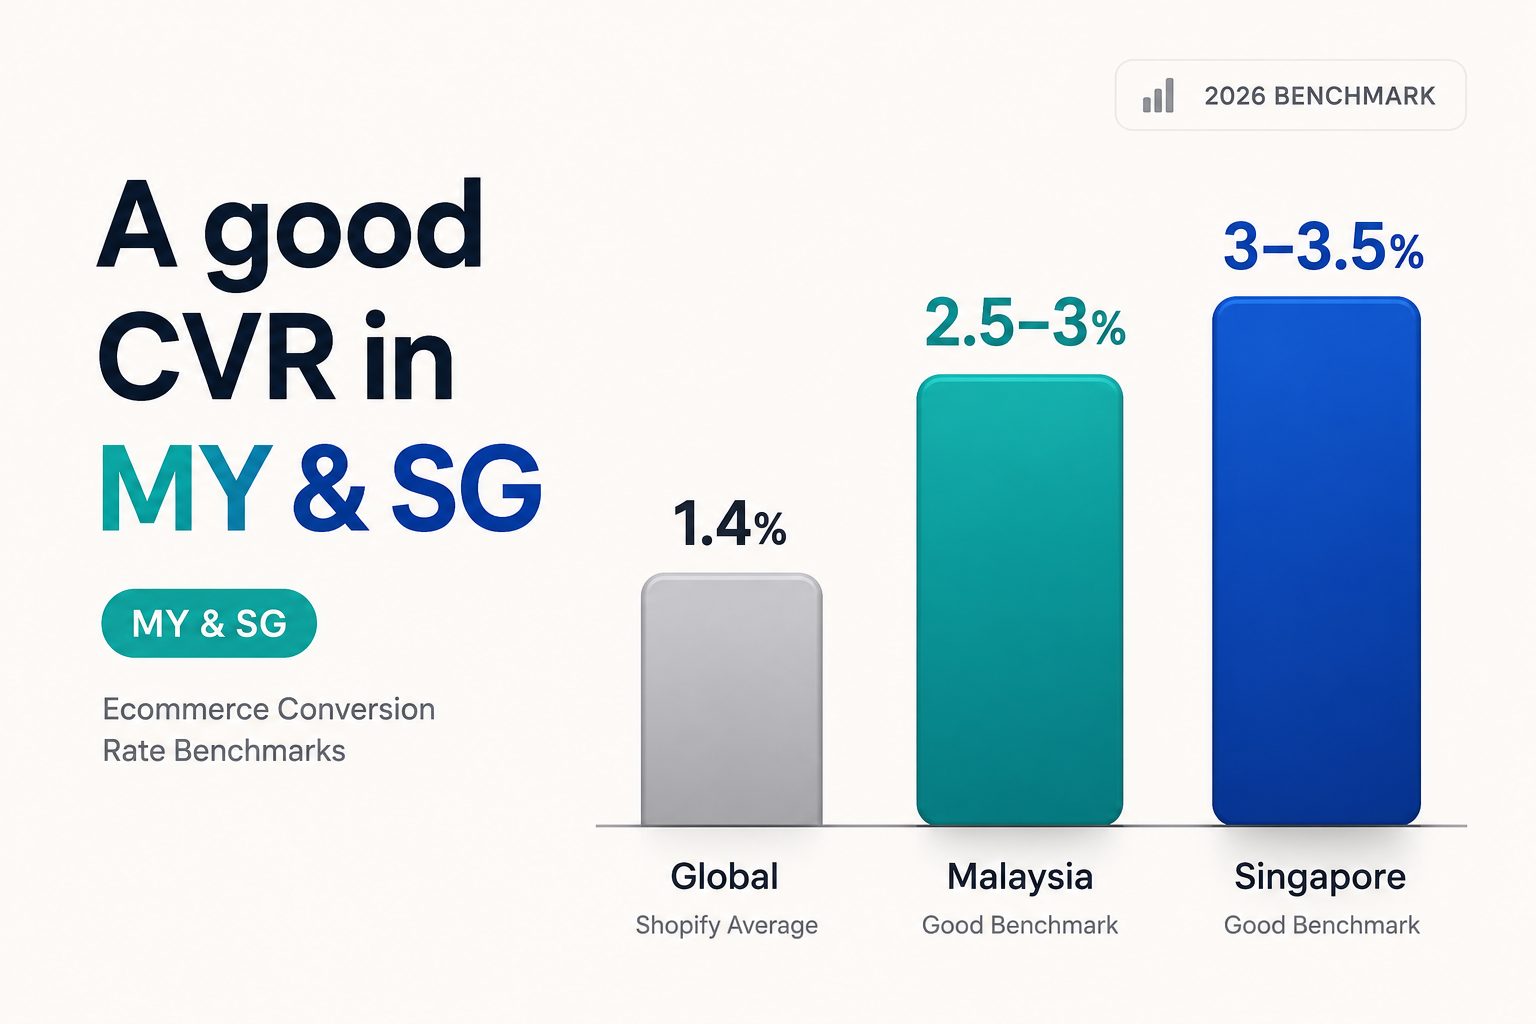
For a DTC brand on Shopify in Malaysia or Singapore, a good ecommerce conversion rate in 2026 sits around 2.5 to 3% in Malaysia and 3 to 3.5% in Singapore, against a projected Southeast Asian band of roughly 2.1 to 3.4% and a global Shopify average near 1.4%. That single number is close to useless on its own. What counts as good depends far more on your vertical, your average order value, your device mix and the quality of your traffic than on the country you sell from. And one thing has to be said upfront: there is no measured, APAC-specific Shopify benchmark broken down by vertical and country. The regional figures here are modelled projections. The reliable hard numbers are global. We will give you both, label which is which, and hand you a way to benchmark your own store instead of chasing an average.
What is a good ecommerce conversion rate in Malaysia and Singapore?
First, the definition, because half the confusion online comes from people comparing different metrics. Conversion rate here means session-to-order: the share of sessions that end in a purchase, the way Shopify, Littledata, IRP Commerce and Dynamic Yield all measure it. If your store gets 10,000 sessions and 250 orders in a month, that is 2.5%.
The most detailed Southeast Asian cut comes from Branch8, which projects DTC conversion rates by market for 2026. Treat these as modelled projections, not measured Shopify data. Branch8 built them from Statista's Digital Market Outlook, the Google, Temasek and Bain e-Conomy SEA report, and Shopify Commerce Trends, not from a panel of live APAC stores.
| Market | 2024 baseline | Projected 2026 range | Position vs global |
|---|---|---|---|
| Singapore | ~2.8% | 3.1 to 3.6% | At or above US average, nearing UK |
| Malaysia | ~2.3% | 2.5 to 3.0% | Approaching global 2.5 to 3% band |
| Thailand | ~2.2% | 2.4 to 2.9% | Just below Malaysia |
| Vietnam | ~1.8% | 2.0 to 2.6% | Converging with global lower band |
| Indonesia | ~1.6% | 1.8 to 2.4% | Below global average, improving |
| Philippines | ~1.5% | 1.7 to 2.2% | Lower end of SEA, catching up |
The takeaway: a fixed threshold like "2.5% is good" cannot be read the same way across markets. A Malaysian store at 2.8% is beating its national projection. A Singaporean store at the same 2.8% is sitting below its own market. Singapore's higher baseline means the bar for good is genuinely higher there.
Why there is no reliable APAC average conversion rate
This is the honest core of the whole question, and it is where most benchmark articles quietly mislead you.
Every hard, measured conversion benchmark in wide circulation is global and Western-default. Littledata's widely cited Shopify average of 1.4% is drawn from around 2,800 stores worldwide. Shopify's own vertical averages, Dynamic Yield's panel, IRP Commerce's market data and Statista's figures are all global. None of them publish a Malaysia or Singapore cut, and none weight for how differently APAC shops. The only source that gives you an explicit SEA country and vertical breakdown, Branch8, is a modelled projection, as noted above.
On top of the geography gap, the numbers disagree with each other for methodological reasons you need to understand before you trust any of them.
- Session versus user. Session-to-order (Shopify, Littledata) and user-based conversion (some GA4 setups) use different denominators. The same store can show 2.5% in one and 3% in the other. Compare like with like.
- Dead stores drag the average down. Littledata is explicit that its 1.4% includes inactive stores and broken checkouts. It is a conservative floor, not a target.
- Some panels skew high. Dynamic Yield's benchmark of roughly 2.74% comes from merchants already using its personalisation and testing tools (Dynamic Yield). That cohort is better optimised than the average store, so its numbers run hot.
So when someone tells you "the average is 1.4%" and someone else says "it is closer to 3%", both can be right. They are measuring different populations with different methods. This is exactly why a single APAC average would be misleading even if one existed. Your real benchmark is your vertical, your device mix and your traffic quality, not a headline figure lifted from a blog.
How does Southeast Asia compare to global conversion benchmarks?
Where regional data does exist, APAC as a whole converts below Western markets. Dynamic Yield's regional split puts EMEA around 2.89%, the Americas around 2.69% and APAC around 1.58%. Statista's visit-based global figure sits near 1.7%, and IRP Commerce reported a cross-industry average of 2.03% in June 2026, up from 1.85% a year earlier.
The gap is structural, not a sign that APAC merchants are worse. Asia-Pacific is deeply mobile-first: smartphones account for roughly 64% of ecommerce transaction value in the region (Mordor Intelligence), and mobile sessions convert lower everywhere. The region also runs heavily through marketplaces and super-apps, which carry trust that independent stores have to rebuild themselves. And the digital economy is still maturing, though fast, as the Google, Temasek and Bain e-Conomy SEA work documents year on year.
The useful nuance for MY and SG brands: Singapore already matches or beats the US average, and Malaysia is closing on the global 2.5 to 3% band. So the "APAC lags" story does not mean you should accept a low number. It means the ceiling in your specific market is higher than a blended regional average suggests.
What is a good conversion rate by industry?
Vertical is the single biggest driver of conversion, bigger than platform or country. A 2.5% rate is excellent for electronics and mediocre for beauty. Benchmark inside your category or the comparison is meaningless.
The table below sets Shopify's global 12-month vertical averages next to Branch8's projected SEA bands. Global figures are measured; SEA figures are modelled projections, and Branch8 only models five categories, so the others are marked accordingly. The electronics global figure is a Shopify-store range (Growthsuite), since Shopify's own list folds it under consumer goods.
| Vertical | Global Shopify avg | SEA projected 2026 | Why |
|---|---|---|---|
| Food and beverage | 6.22% | 4.5 to 6.0% | Low AOV, repeat need, immediate intent |
| Beauty and personal care | 4.94% | 3.2 to 4.0% | Repeat purchase, subscriptions, loyalty |
| Multi-brand retail | 3.93% | no SEA cut | Broad assortment, convenience buying |
| Fashion and apparel | 3.06% | 1.8 to 2.5% | Sizing and returns anxiety |
| Consumer goods | 2.85% | no SEA cut | Mid consideration |
| Electronics and gadgets | 1.4 to 2.3% | 1.5 to 2.0% | High AOV, long research cycle |
| Home and furniture | 1.41% | 1.4 to 1.9% | High AOV, physical inspection, logistics |
| Luxury and jewellery | 0.94% | no SEA cut | High ticket, high trust threshold |
If your beauty store converts at 2.5%, you are behind your category despite beating the global all-store average. If your furniture store converts at 1.4%, you are performing normally and should probably chase order value, not conversion. Read your number against the right row.
Mobile vs desktop: which conversion rate should you expect?
Device changes the picture, and in a mobile-first region it changes it a lot. On a typical Shopify store, Littledata puts mobile conversion near 1.2% and desktop near 1.9%, roughly a 35% gap. Less-optimised stores commonly see mobile running 30 to 40% below desktop.
The gap is closing in well-built stores. In Dynamic Yield's optimised cohort, mobile (around 2.86%) has nearly reached parity with desktop, helped by one-tap payments and cleaner mobile checkout. So a wide mobile-to-desktop gap is not a law of nature, it is a signal your mobile funnel has friction.
Here is why this matters for reading your blended number. If your desktop converts at a healthy 3% but mobile sits at 1.5%, and mobile is 70% of your traffic, your blended rate lands near 2%. A strong desktop store can look average purely because most of its traffic arrives on a mobile experience that leaks. In MY and SG, where the majority of sessions are mobile, that is the common story. A reasonable healthy baseline for most mid-ticket stores here is mobile above 1.5 to 2% and desktop above 2.5 to 3%, with the top quintile pushing mobile past 2.5%.
Does average order value change what counts as good?
Yes, and it works against conversion in a predictable way. Lower AOV and higher purchase frequency lift conversion, because the buyer is taking less financial risk per order. Higher AOV and longer consideration lower it, but each order is worth more. A grocery brand converting at 5% and a furniture brand converting at 1.4% can both be healthy.
One honest limit: no benchmark cuts conversion by AOV band directly. Vertical is the working proxy, since category and price point move together. We will not invent a Malaysian or Singaporean AOV figure here, because reliable public MY and SG AOV data does not exist. Pull your own from GA4 or Shopify, segment it by device and country, and read it alongside conversion.
The real target is not conversion in isolation, it is revenue per session (Shopify on AOV). A high-AOV brand is often better off improving bundles, financing and upsells than forcing conversion toward a number its category will never hit.
Is a 1.5% conversion rate good for my store?
Straight answer: 1.5% is within the typical Shopify band (roughly 1.4 to 1.8% for live stores), but it is below the global ecommerce range of 2 to 3% and below the projected SEA DTC ranges for both Malaysia and Singapore. So it is not a disaster, but for most stores it is under-optimised rather than good.
When 1.5% is genuinely fine: high-AOV or considered-purchase categories like furniture, electronics or luxury, where 1 to 2% is normal and revenue per order is high. Or a store running a lot of cheap, low-intent social traffic that dilutes the blended rate while high-intent segments convert well.
When 1.5% is a problem: a low-to-mid ticket DTC store in fashion, beauty or food, where the category average sits well above 2%. That gap is usually a funnel issue, not a traffic issue. Check mobile conversion against desktop, checkout completion, page speed and whether your traffic mix is mostly discovery-stage social. A store we would expect at 3%-plus sitting at 1.5% is leaving most of its revenue on the table.
How to benchmark your own store properly
Stop hunting for one APAC number. Benchmark your own store against the right reference points instead. This is the method we use on every audit.
- Define the metric once. Decide whether you are reading session-to-order or user-based, and use it consistently. Do not compare your GA4 user-based rate against a session-based benchmark.
- Segment by country and device in GA4. Break conversion out by Malaysia versus Singapore and mobile versus desktop. The blended number hides where the actual problem is.
- Compare against your vertical band, not the global average. Use the industry table above. A number is only good or bad relative to your category.
- Separate DTC from marketplace. Do not compare your Shopify conversion to your Shopee storefront. Marketplaces convert higher for structural reasons, covered below. Benchmark DTC against DTC.
- Watch the trend, not the snapshot. Month-on-month improvement matters more than a static comparison against someone's table. A store moving from 1.8% to 2.4% is winning, regardless of the global average.
- Read your traffic-source mix. Referral and email traffic convert far higher than paid social. If your traffic is mostly discovery-stage social, a lower blended rate is expected, and the fix is channel and funnel design, not panic.
For a sense of what real movement looks like once the funnel is fixed: on Convx client stores, renaming and restructuring navigation drove a 78% revenue increase and a 21% lift in conversion rate, adding quick filters lifted conversion by 75%, and expanding a visual product preview lifted conversion by 8.7% with a 14% revenue gain. Those are relative lifts from specific tests on specific stores, not an APAC benchmark. We do not publish an aggregate APAC conversion figure, because an honest one does not exist. The value is in diagnosing a single store against the right vertical, device and AOV reference, then removing the friction that is holding it below its band. That is what our CRO service is built to do.
Frequently Asked Questions
What is a good ecommerce conversion rate in Singapore?
Singapore DTC stores are projected to convert around 3.1 to 3.6% by 2026 (Branch8, modelled from Statista and e-Conomy SEA data), which is at or above the US average. As a working rule, 3% and above is healthy in Singapore and 3.5% and above is strong, but always read it against your vertical: a beauty brand should clear 4%, while an electronics brand at 2% may already be doing well.
What is the average Shopify conversion rate?
Around 1.4%, based on Littledata's analysis of roughly 2,800 stores measured session-to-order. That figure includes inactive stores and broken checkouts, so it is a conservative floor rather than a target. For live, actively run stores, 1.8 to 3.2% is a healthy range, above 3.2% is top-20% territory and above 4.7% is top 10%.
Is a 1.5% conversion rate good?
It is within the typical Shopify band but below the global 2 to 3% range and below the projected SEA DTC ranges. It is acceptable for high-AOV categories like furniture or electronics, and for stores running lots of low-intent traffic, but for a low-to-mid ticket DTC store in fashion, beauty or food it usually signals an under-optimised funnel worth fixing.
Why is my conversion rate lower than the benchmarks I read online?
Usually one of four things. You may be comparing a session-based number to a user-based one. The benchmark may come from a CRO-invested cohort that runs hot. Your traffic may be mobile-heavy or discovery-stage social, both of which convert lower. Or you may be comparing your own Shopify store to marketplace conversion rates, which is not a fair comparison.
Do marketplaces like Shopee convert higher than my own Shopify store?
Yes, and it is structural. Marketplaces bundle trust that a standalone store has to earn: reviews, seller ratings, buyer protection and a large pool of ready-to-buy shoppers. Your own site can trail on raw conversion while still being the better long-term bet, because it gives you the customer data, the margin and the brand ownership that marketplaces keep for themselves.
Where to start
If your conversion rate is sitting below your vertical band, that is a conversion problem, not a traffic problem, and buying more traffic will not fix it. Start by segmenting your own data by device and country, compare each segment to the right benchmark row above, and find the stage of the funnel that is leaking.
If you want a second set of eyes on where your store is losing revenue, Convx runs CRO and technical Shopify audits for MY and SG brands, grounded in your real GA4 and Shopify data rather than a generic benchmark. As a Shopify Plus Partner, we can also pressure-test your build and checkout setup. If that is useful, talk to us.